Introduction to GIS:
Navigating the World of
Geospatial Technology
Have you ever wondered how businesses, government agencies, and individuals make critical decisions using maps and data? Look no further! Geographic Information System (GIS) is the answer—a powerful tool that surpasses basic mapping software. With GIS, users can effortlessly visualize data on maps, conduct advanced statistical analysis, and even predict outcomes through unique spatial analysis features. It’s no wonder that numerous organizations rely on GIS for strategic planning, disaster response, urban development, and much more. In this article, we invite you to embark on an immersive journey into the captivating world of GIS, where we’ll delve into the extraordinary capabilities that set it apart from other information systems. So, let’s embark on this exciting exploration together!
Basic Understanding of GIS
Component of GIS
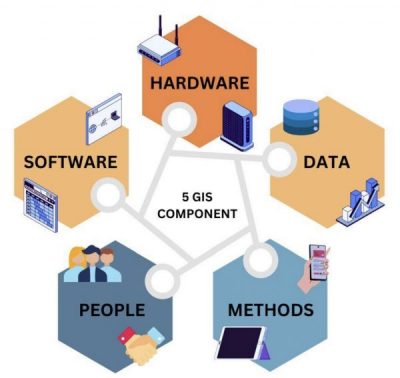
When we talk about GIS, there are five main components that work together to make it happen. Let us break them down for you in an easy-to-understand way:
- Hardware: This is just a fancy word for the computer you use to run your GIS software.
- Software: The software is what gives you all the tools you need to create and edit spatial information. It’s like paintbrushes and canvas for an artist!
- Data: This is the information that you visualize and tabulate using GIS. It could be anything from population numbers to land boundaries to weather patterns.
- People: Of course, no system would work without users! You’re the ones who make decisions based on the data you see in GIS.
- Methods: Lastly, the methods used in GIS can vary depending on why you’re using it. For example, if you’re studying traffic patterns, your methods will be different than if you’re mapping out wildlife habitats.

Component of GIS
GIS Geographic Information
GIS (Geographic Information System) is all about the geography of things. It’s basically a way to collect and analyze data that has a location attached to it. When we talk about “spatial location data,” we mean information that tells us where something is in relation to other things. This could be anything from the location of a tree in a park to the coordinates of a city on a map.
On the other hand, “attribute data” is more like information about what something is. We can use this kind of data to help us understand patterns and relationships between different features on the map.
So how do we actually use GIS? Well, one important tool is the attribute table. This is kind of like an Excel spreadsheet that shows all of the attributes for each feature on our map. By looking at the table, we can filter out certain features or query specific aspects of the data. This helps us better understand the patterns and relationships between different features in the area we’re studying.
Two types of GIS Data
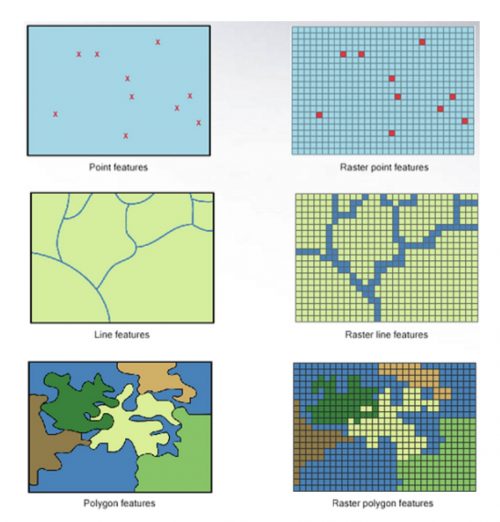
Let’s talk about the types of GIS data. vector data and raster data.
- Vector data
It’s basically categorical data that are stored in the form of geometrical shapes, like points, lines, and polygons:- Points: These are single x and y coordinate locations that represent specific locations on a map. They are commonly
used to identify landmarks, buildings, and other important geographic features. - Lines: These are defined by connecting two or more points with straight lines. They are used to represent linear
features such as roads, rivers, borders, and other linear features. - Polygons: These are closed shapes formed by connecting multiple points with lines. They are used to represent areas such as parks, buildings, or land parcels. Polygons are particularly useful for representing features that have a defined boundary, such as lakes, forests, and other natural features.
- Points: These are single x and y coordinate locations that represent specific locations on a map. They are commonly
- Raster data
It’s a type of digital image that is composed of a matrix of pixels or cells. Each cell contains a value that represents a specific circumstance for the area covered by the pixel. Raster data is commonly used to represent continuous data such as temperature, elevation, and other geographic features.
Some of the common formats used for storing raster data include JPEG, BMP, PNG, and TIFF. These formats allow for the efficient storage and manipulation of large amounts of raster data.

Types of GIS data (Cal Poly Humboldt)
GIS Evolution
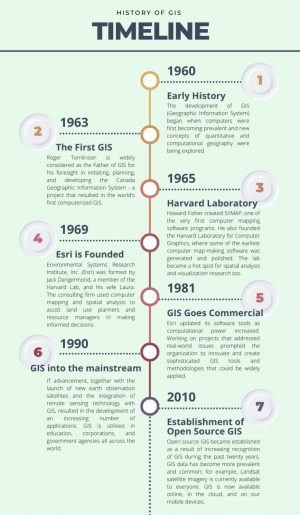
Incredible as it may seem, GIS has a rich and storied past. It all began in the 60s with computers and the birth of quantitative and computational geography. Can you even fathom what life was like back then? In fact, way back in 1963, Tomlinson got things rolling by conceiving, organizing, and creating Canada’s Geographic Information System – the very first computerized version of what we now call GIS!

Info source from Esri and bcs.org
It’s amazing how far GIS has come since those early days, but it wouldn’t have been possible without the dedication of companies like Esri who saw the potential for using technology to benefit society. Who knows what the future holds for GIS, but one thing is certain: it will continue to evolve and help us better understand our world.