Harnessing the Power of GIS for Global Climate
Solutions:
A Path to a Sustainable Future
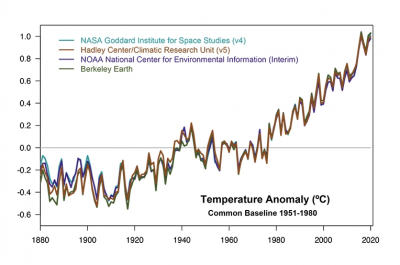
Climate change poses a significant threat to our planet, manifesting in various ways. From the increased frequency of extreme weather events to rising sea levels and melting ice sheets, the consequences of a warming Earth are becoming increasingly evident. According to NASA, global surface temperatures have risen by approximately 1.62 degrees Fahrenheit since the first global temperature measurements were taken in the late 19th century. Though seemingly modest, this increase has already caused profound environmental changes.

Comparison of four independent methods for estimating global temperature anomalies (NASA)
To truly grasp the urgency, let’s delve deeper into the impacts. Consider the intensified heatwaves, prolonged droughts, and devastating wildfires becoming more prevalent around the globe. Furthermore, the alarming rate of ice sheets and glacier melt contributes to the inexorable rise in sea levels, posing a direct threat to coastal communities and cities.
It’s crucial that we take action to mitigate climate change and reduce our carbon footprint. Every individual, community, and government has a role to play. By embracing sustainable practices, transitioning to renewable energy sources, and advocating for impactful policies, we can collectively safeguard our environment and ensure a sustainable future.
Fortunately, we are not helpless in the face of climate change. We have powerful tools at our disposal, and one of them is GIS technology. This invaluable resource empowers scientists and organizations to monitor threats, analyze data, and visualize complex climate information with precision and clarity.
As spatial consultants, we possess a unique opportunity to make a tangible difference in the world. By harnessing the power of GIS, we can contribute to the study of climate change, employing reliable data and detailed visualizations to inform critical decisions and shape resilient strategies for the future.
Understanding the gravity of the situation is just the first step. Together, we can make a difference and create a healthier, more resilient planet for generations to come.

Photo by © Steve Morello – WWF Canon
CLIMATE CHANGE IS A THREAT!
Impacts of Climate Change
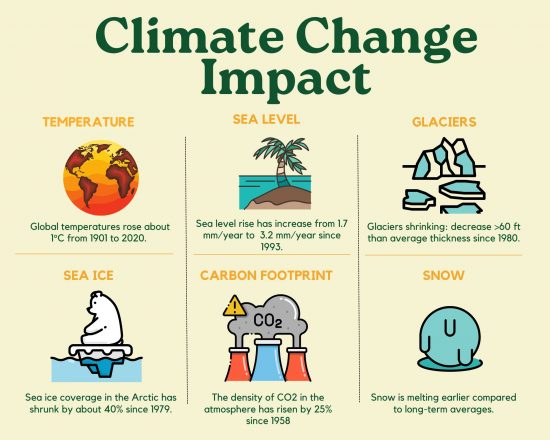
The dynamics of the Earth’s climate system are complex, influenced by various factors. When energy from the sun is reflected off the Earth and released into space, the planet cools. Conversely, it heats up when it absorbs the sun’s energy or when greenhouse gasses trap heat and prevent its escape into space. These interactions, coupled with natural and human-made factors, have profound impacts on our climate system

Info source from NOAA
LET’S ASSESS USING GIS!
What Can GIS Do?
Spatial consultants utilize GIS technology to gather and portray climate change data through diverse approaches:
- Collect and represent climate change data
- Identify areas with abnormal temperatures compared to the global average
- Develop models showing the ecological impact of climate change
- Investigate the relationship between climate change and land cover changes
- Visualize factors impacting crop growth, industry, and wildlife.
Example 1: Carbon Emission Map

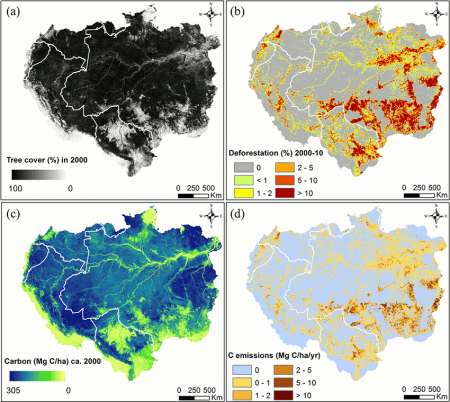
Maps of forest, deforestation, carbon stocks and carbon emissions in the Amazon basin (Song, et. al., 2015 )
The diagram above clearly demonstrates the effectiveness of two key strategies in mitigating global warming: promoting forest expansion and curbing deforestation. These approaches offer straightforward and efficient means of reducing CO2 levels in the atmosphere. To effectively monitor carbon content, GIS techniques come into play, enabling us to accurately map forest carbon distribution.
Through the utilization of GIS data, climate mapping, and estimation, we gain valuable insights into projected climate shifts. GIS-based climate change simulations further enable us to assess the localized impacts of these shifts. Armed with the capabilities of GIS technology, we can navigate the complexities of climate change and make well-informed decisions toward a sustainable future.
Example 2: Hazard Map

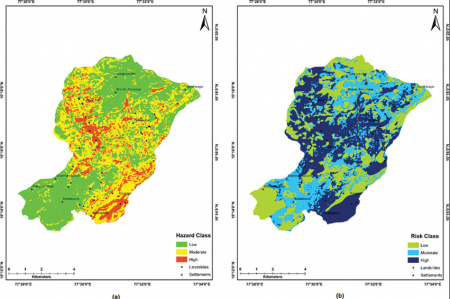
Landslide Hazard Map & Risk Map of Tevankarai Stream Watershed, Kodaikkanal, India (Ramani, et. al., 2014)
As our planet experiences rising temperatures, the occurrence of severe weather events like floods and heatwaves is on the upswing. In the realm of disaster response, GIS technology has emerged as an invaluable resource. By utilizing GIS techniques, we gather and analyze pertinent data to generate hazard maps, similar to the illustration provided, that furnish authorities with up-to-the-minute information about the situation and pinpoint areas in urgent need of attention. This enables first responders to take prompt and effective action, potentially saving lives and curbing the extent of the damage. Thanks to the availability of remote sensing data and satellite imagery, governmental agencies can remain well-informed about potential hazards even before they materialize. Moreover, in the aftermath of a disaster, GIS aids recovery teams in assessing the extent of damage and devising strategies for rehabilitation and reconstruction.
So, the next time you witness an emergency worker actively engaged in responding to a natural calamity, take cognizance of the pivotal role played by GIS in facilitating their swift and efficient response. As climate change continues to exert its influence on our world, it becomes increasingly crucial that we persevere in our investment in this powerful technology.
CONCLUSION
To wrap it up, GIS technology has emerged as a vital ally in the battle against climate change. By harnessing the expertise of skilled professionals, we can uncover the risks and vulnerabilities associated with a changing climate and respond with precision. From monitoring climate-related disasters to preparing our communities for the challenges ahead, GIS empowers us to adapt and build resilience. With its capacity to offer valuable insights into present and future conditions, GIS paves the way for effective strategies that safeguard our planet and ensure a sustainable future. Together, let’s embrace the power of GIS and chart a course toward a climate-resilient world.

Photo by Jeff Sloot
SOURCES:
- GLOBAL CLIMATE CHANGE ASSESSMENT USING GIS. (2021, September 27). [web log]. Retrieved June 20, 2023, from
https://www.satpalda.com/blogs/global-climate-change-assessment-using-gis#0. - NASA. (2023, January 12). Video: Global warming from 1880 to 2022 – climate change: Vital signs of the planet. NASA.
https://climate.nasa.gov/climate_resources/139/video-global-warming-from-1880-to-2022/#:~:text=Continuing%20the%20planet’s%20long%2Dterm,GISS - Song, X.-P., Huang, C., Saatchi, S. S., Hansen, M. C., & Townshend, J. R. (2015). Annual carbon emissions from
deforestation in the Amazon Basin between 2000 and 2010. PLOS ONE, 10(5). https://doi.org/10.1371/journal.pone.0126754 - Sujatha, E. R., & Rajamanickam, G. V. (2014). Landslide hazard and risk mapping using the weighted linear combination
model applied to the Tevankarai Stream watershed, Kodaikkanal, India. Human and Ecological Risk Assessment: An International Journal, 21(6), 1445–1461. https://doi.org/10.1080/10807039.2014.920222